
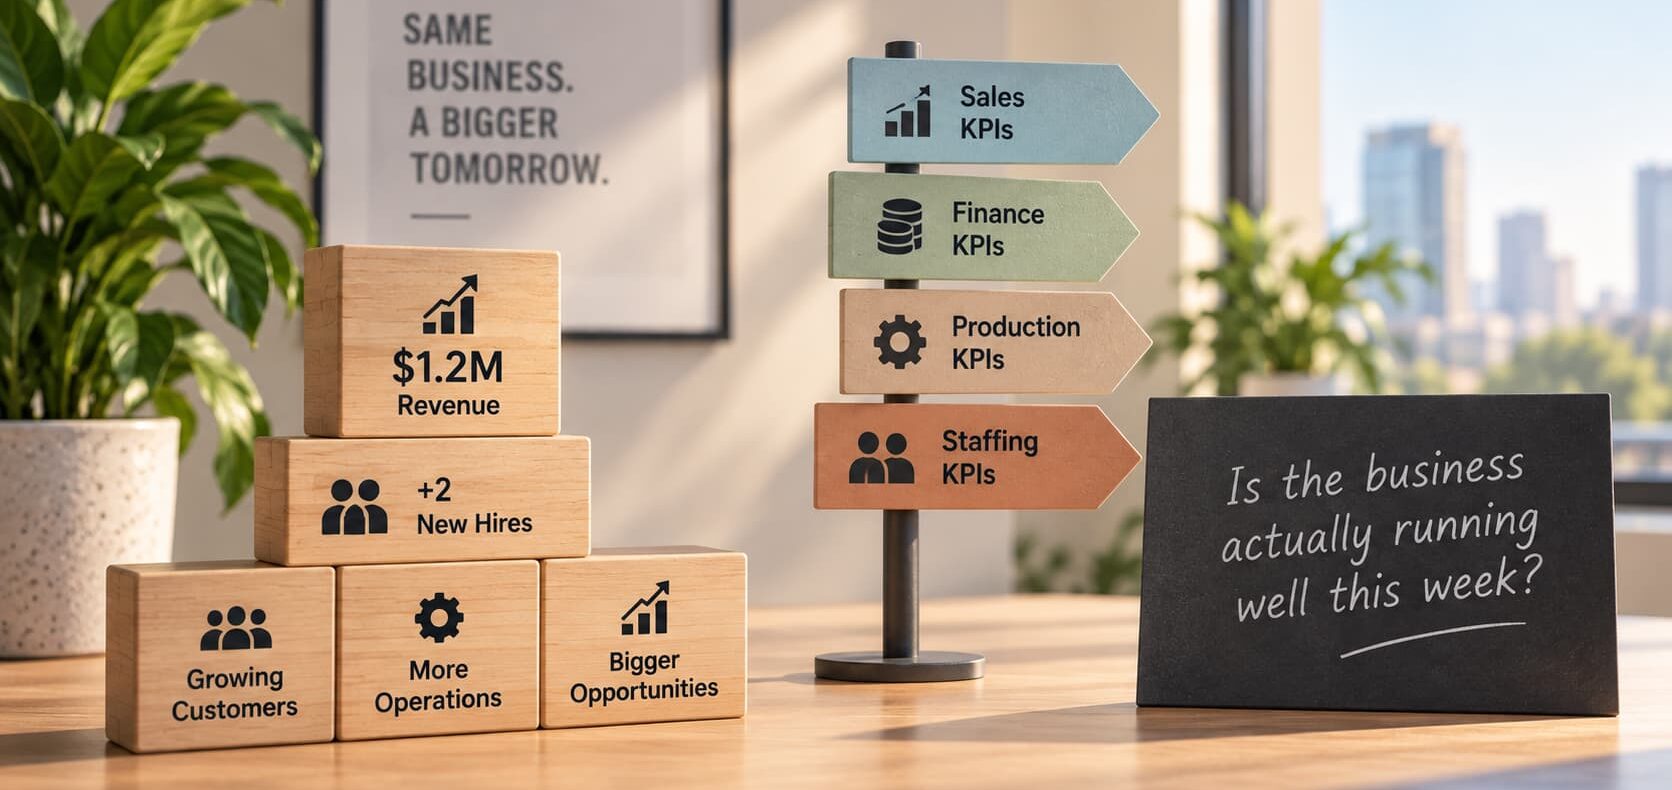
A founder hits $1.2M in revenue, hires two more people, and suddenly can’t answer a simple question: is the business actually running well this week? That blind spot is what operational KPIs exist to close. This article walks through what these metrics are, why they change as you grow, and how to set the right ones for each part of your business, from sales and finance to production and staffing.
What operational KPIs are and how they differ from other metrics
Operational KPIs track how work actually gets done: cycle time, throughput, defect rate, on-time delivery. They answer one question: is the machine running properly right now? Strategic KPIs ask something different.
Strategic KPIs look at long-term outcomes: revenue growth, market share, gross profit margin over a year. Operational metrics look at the daily and weekly work that produces those outcomes. Both matter, but they serve different people. Leadership reviews strategic KPIs quarterly, while a production manager checks operational metrics every shift.
Many founders assume any number on a dashboard counts as a KPI. In reality, a KPI is a metric tied to a specific decision someone will make. If nobody acts on it, it’s just data. The American Productivity & Quality Center’s process and performance guidance frames key performance indicators as tools for comparing actual performance against a defined target, not as a general reporting habit. That distinction keeps a scorecard useful instead of cluttered. If you’re unsure where to start, identifying the right KPIs for your business is the foundational step before building out any scorecard.
Why operational KPIs matter for visibility and decision-making
Growth without systems creates friction, and the first thing that breaks is visibility. When a business runs on the founder’s gut, that works fine at ten orders a week. At two hundred, the founder becomes the bottleneck because every judgment call still routes through one person.
Operational KPIs give leadership a shared picture of what’s happening without needing to be in every room. Decision-making speeds up when a manager can see order fulfillment cycle time slipping on Tuesday instead of hearing about it from an unhappy customer on Friday. Operational visibility turns reactive firefighting into planned adjustment.
There’s also an accountability effect. When performance metrics are visible, teams naturally align around them, and tracking them consistently reinforces that alignment over time. The SBA guidance on managing business finances and performance points founders toward tracking measurable indicators as a foundation for sound decision-making. The issue usually isn’t effort, it’s that nobody can see clearly enough to act early.
How to set operational KPIs (the step-by-step foundational approach)
Setting operational KPIs is less about picking impressive numbers and more about mapping metrics to how the business creates value. Here’s a practical sequence.
- Identify how the business actually makes money, then trace the operational steps that deliver it.
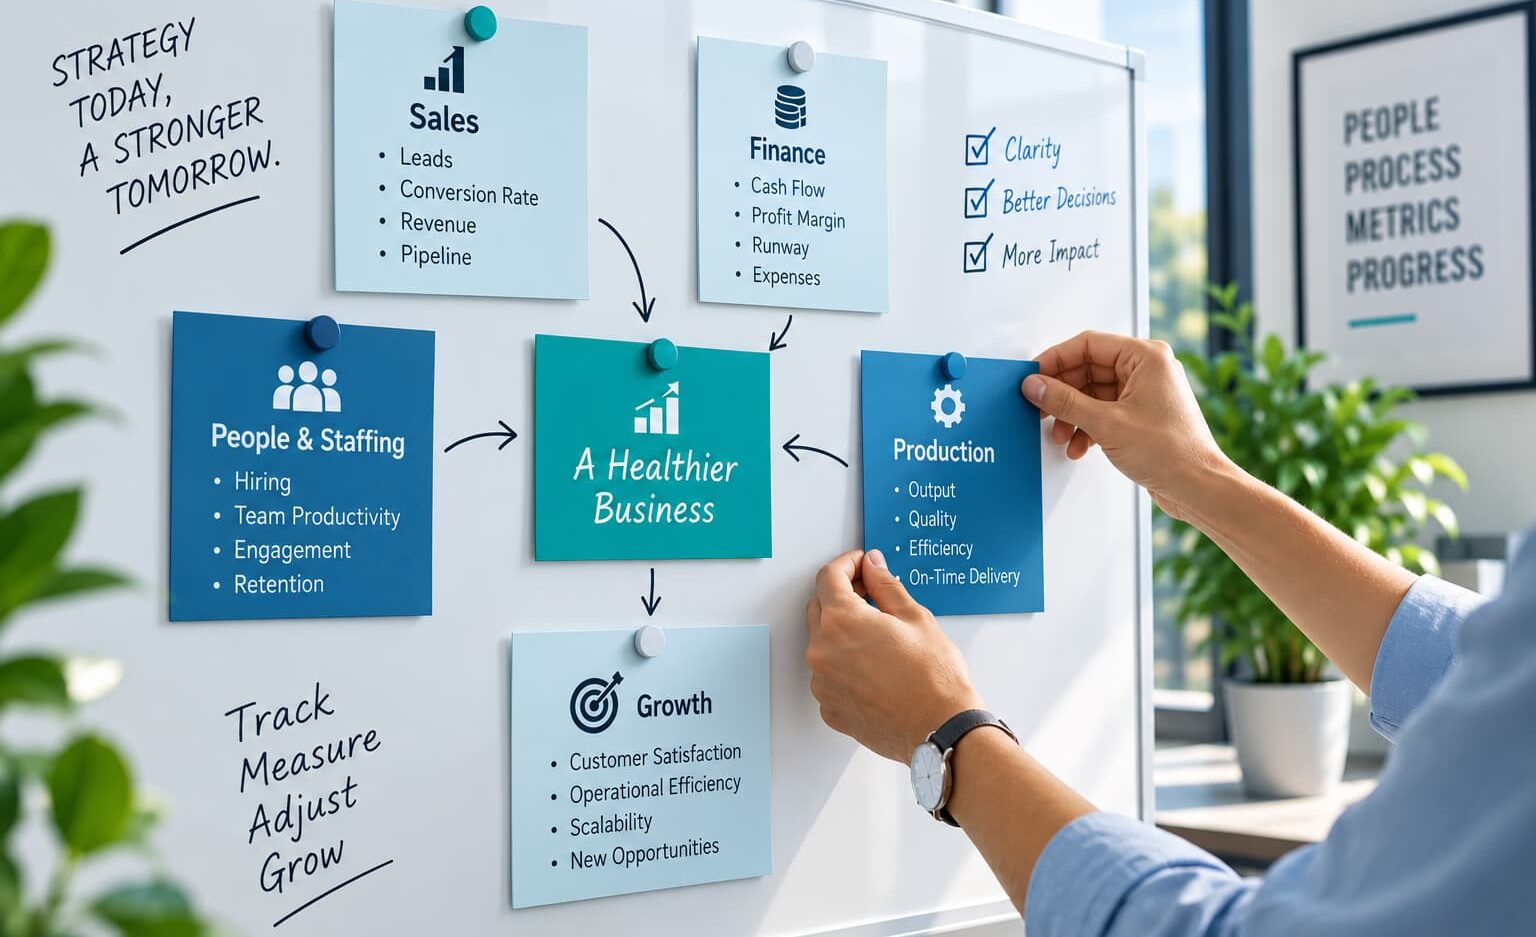
- Break the business into functions: sales, finance, service, production, staffing.
- For each function, name the one or two things that most affect output or cost.
- Choose measurable indicators for those things, aiming for 5-7 core operational KPIs total, not per function.
- Set a baseline by measuring current performance before you set targets.
- Define a realistic target and a review cadence (daily, weekly, or monthly).
- Assign a KPI owner responsible for the number.
- Build a simple reporting dashboard so the data is visible without manual pulls.
- Run a KPI audit after 90 days and cut metrics nobody acts on.
Anyone researching how to set KPIs will find this framework works whether you’re a manufacturer or a service firm. The functions differ, but the discipline doesn’t. Founders looking for structured execution around this process often turn to The Integrator package for KPI framework execution, which builds the scorecard and reporting cadence alongside leadership rather than leaving it as a one-time exercise.
Sales and customer acquisition KPIs
Operational sales KPIs focus on the process of winning customers, not just the revenue at the end. Founders often watch closed deals and stop there. That’s a lagging number. By the time it moves, the causes are weeks old.
Among the clearest kpi examples for sales teams are lead response time, conversion rate at each pipeline stage, average deal cycle length, and win rate by lead source. These operational metrics tell you where deals stall before revenue suffers.
Consider a service company adding a second salesperson. Revenue looks flat, so the founder blames the new hire. The real cause: lead response time doubled because inquiries weren’t routed properly, and slow follow-up hurt conversion. Without operational visibility into the pipeline, that stays invisible until a quarter is lost. Building a KPI framework around the sales process, not just the outcome, is where Four Indoor Courts helps founders design performance tracking that catches problems while there’s still time to fix them.
Financial operations KPIs
Operational financial KPIs focus on cash movement and margin discipline, not the annual profit-and-loss statement. A business can be profitable on paper and still run out of cash. That’s why operating cash flow sits near the top of most operations scorecards.
Track a handful of practical financial KPIs: operating cash flow, gross profit margin by product or service line, days sales outstanding, and inventory turnover if you hold stock. Days sales outstanding tells you how long money sits in receivables. Inventory turnover tells you whether cash is trapped on shelves.
What can happen when these go unmonitored: a growing business books more sales, extends more credit, and quietly strains its working capital. Revenue climbs while the bank account tightens. Watching gross profit margin by line also reveals which parts of the business fund the rest, one of several business performance metrics that support growth when tracked consistently. Financial reporting and tax treatment vary by jurisdiction, so verify specifics with your accountant or your country’s tax authority rather than assuming one rule fits all.
Customer satisfaction and service KPIs
Customer satisfaction KPIs measure whether the operation is keeping the promise the sale made. For service businesses, this is often the difference between growth and a leaky bucket. Winning new customers means little if existing ones churn out the back.
Track first response time, resolution rate, average handle time, and net promoter score. Net promoter score gives a directional read on loyalty. Resolution rate tells you whether problems get fixed or just acknowledged. These customer satisfaction KPIs are leading indicators of retention.
A common pattern: teams that measure ticket volume but not resolution rate. They look busy; they close hundreds of tickets, and customers still leave because nothing actually gets solved. Volume is activity; resolution is outcome. Satisfied customers can cost less to retain than new ones cost to acquire, so service operational KPIs help protect margin as much as reputation.
Manufacturing and production KPIs
Manufacturing KPIs reward specificity because waste hides in plain sight on the production floor. A line can look busy while quietly losing money through rework and idle time. The right operational metrics expose that.
Among the clearest KPI examples in manufacturing are overall equipment effectiveness, first-pass yield, scrap rate, and capacity utilization. Overall equipment effectiveness combines availability, performance, and quality into one figure, so it’s a strong signal of whether a line is truly productive. First pass yield shows how much comes out right the first time. Scrap rate shows what you’re throwing away.
Picture a small manufacturer running at what feels like full tilt. Capacity utilization reads high, but first pass yield is 82%, meaning nearly a fifth of output needs rework. That rework eats the capacity the founder thinks is maxed out. Chasing operational improvement on the factory floor usually starts with first pass yield and scrap rate, because they turn vague “we’re busy” feelings into numbers you can actually improve.
Productivity and workforce/staffing KPIs
Productivity KPIs and staffing KPIs answer whether your people and hours are producing what they should. This is where measuring productivity gets misunderstood: it isn’t about surveilling employees; it’s about spotting where the process, not the person, is losing time.
Useful productivity KPIs include output per labor hour, utilization rate for billable teams, revenue per employee, and overtime as a percentage of total hours. For service firms, billable utilization is often the clearest read on operational efficiency. Rising overtime with flat output usually signals a broken process, not lazy staff.
Many businesses assume a productivity problem means they need better employees. In reality, it’s often a systems problem: unclear priorities, stalled handoffs, or tools that create friction. New hires won’t fix a workflow that leaks time. Good staffing KPIs separate those two causes so leadership fixes the right thing, turning raw effort into operational efficiency instead of burnout.
Assigning KPI ownership and accountability
A metric without an owner is a metric nobody improves. Every operational KPI on your scorecard needs one named KPI owner, a single person accountable for the number and empowered to act on it. Shared ownership means no ownership.
Team accountability starts with clarity about who watches what. The production manager owns first pass yield. The service lead owns resolution rate. The finance lead owns days sales outstanding. When a number drifts, there’s no debate about whose job it is to respond.
The root cause of most stalled improvement isn’t a missing dashboard; it’s that everyone assumed someone else was watching. Assigning a KPI owner also protects founders from the trap of owning every metric themselves, which quietly reinforces the founder dependency they’re trying to escape. Four Indoor Courts builds delegation and team accountability frameworks so operational KPIs actually get acted on by the right person, not funneled back to the founder’s desk.

Common challenges in creating KPIs by business function
The most common mistake is tracking too much. A scorecard with thirty metrics feels thorough and delivers little, because attention scatters and nobody knows which number matters most this week. Focus beats coverage.
The second challenge is choosing vanity metrics that look good but don’t tie to how the business earns. Website visits, total tickets closed, gross activity counts: these create false confidence. Real operational visibility comes from metrics linked to output, cost, or retention.
A third issue is inconsistent definitions across functions. If sales measures cycle time one way and operations measures it another, the reporting dashboard becomes a source of arguments instead of decisions. Agree on definitions before you build anything.
Finally, teams set KPIs and never revisit them. Business functions need to change as the company grows, and a metric that fit last year may now be noise. A quarterly KPI audit keeps the scorecard honest and keeps every business function measuring what currently matters.
How founder-led SMBs should set operational KPIs as they scale past $1M
Something shifts around the $1M mark. Below it, a founder can personally see most of what happens. Above it, the business generates more activity than one person can track, and gut feel stops scaling. That’s the moment operational KPIs move from optional to necessary.
Early-stage scorecards lean on volume: orders completed, calls handled, units shipped. As you cross $1M and add people, the useful operational metrics shift toward quality and efficiency: first-pass yield instead of units, resolution rate instead of ticket count. Volume told you the business was busy; efficiency tells you whether it’s healthy.
For founders wondering how to set KPIs at this stage, start narrow. Pick the 5-7 that map to your specific model, and assign owners before you expand. Small business KPIs should support sustainable operations, not create a reporting burden that pulls leadership away from the work, since the goal is operational clarity you can maintain, not a dashboard you admire once and abandon. If you’re not sure where your current scorecard stands, you can get a free Readiness Audit to see which metrics actually reflect your operation today.
If your business is growing faster than your systems can support, one way to find where operational friction is slowing progress is to look at the right numbers with someone who’s built these frameworks before. Four Indoor Courts embeds fractional COO leadership to design operational KPI frameworks and performance tracking tailored to founder-led SMBs. You can book a clarity call to map your operational blind spots and see where a focused scorecard could help you regain visibility.
FAQs
Q1. What are some real examples of operational KPIs?
A1.
Common examples include cycle time, throughput rate, capacity utilization, defect rate, on-time delivery, and cost per unit. Most operations scorecards track 5-7 of these core metrics rather than trying to monitor everything at once.
Q2. What are the 5 key performance indicators most operations teams track?
A2.
A typical starter set covers cycle time, throughput, capacity utilization, error or defect rate, and on-time completion rate. The right five depend on whether the business is production-heavy, service-based, or transaction-driven.
Q3. How is an operational KPI different from a strategic KPI?
A3.
Strategic KPIs track long-term outcomes like revenue growth or market share, and leadership reviews them over months or years. Operational KPIs track daily or weekly execution, things like response times or output per shift, and are owned by managers monitoring day-to-day performance.
Q4. Do operational KPIs actually change as a company grows, or are they fixed once you set them?
A4.
They shift as complexity increases; early-stage businesses often track volume (orders completed, calls handled), while more mature operations shift toward quality and efficiency metrics like error rate or cost per unit. A KPI set built for a $1M business rarely fits a $5M business without revision.
Q5. Is tracking operational KPIs worth the time for a small, founder-led business?
A5.
It’s worth it once a business has outgrown the founder’s ability to personally check on every process, usually somewhere around or after the $1M mark. Below that, informal tracking may be enough, but past it, blind spots in cycle time or delivery consistency start costing real money.
Q6. What if we pick the wrong operational KPIs, does that do more harm than good?
A6.
Yes, tracking metrics that don’t tie back to your business model (like generic activity counts) can waste reporting time and create false confidence. Metrics should map to what actually drives the business, such as equipment utilization for manufacturers or resolution rate for service teams.
Q7. How many operational KPIs should a business actually monitor at once?
A7.
Most operations consultants recommend narrowing a scorecard down to 5-7 core KPIs, supplemented by additional diagnostic metrics as needed. Tracking too many at once dilutes focus and slows decision-making.
Q8. Can operational KPIs alone fix a business that's overly dependent on its founder?
A8.
No, KPIs surface bottlenecks, but they don’t resolve founder dependency on their own. That requires pairing the metrics with delegation and accountability structures so someone besides the founder acts on the data.

Founder of Four Indoor Courts Consulting, Leah Norris helps founders and growing businesses create operational clarity through fractional COO leadership, KPI-driven analytics, and scalable operational strategy. With a background spanning operations, finance, analytics, marketing, and technology, Leah specializes in helping businesses improve visibility, streamline processes, strengthen accountability, and build the operational structure needed for sustainable growth.