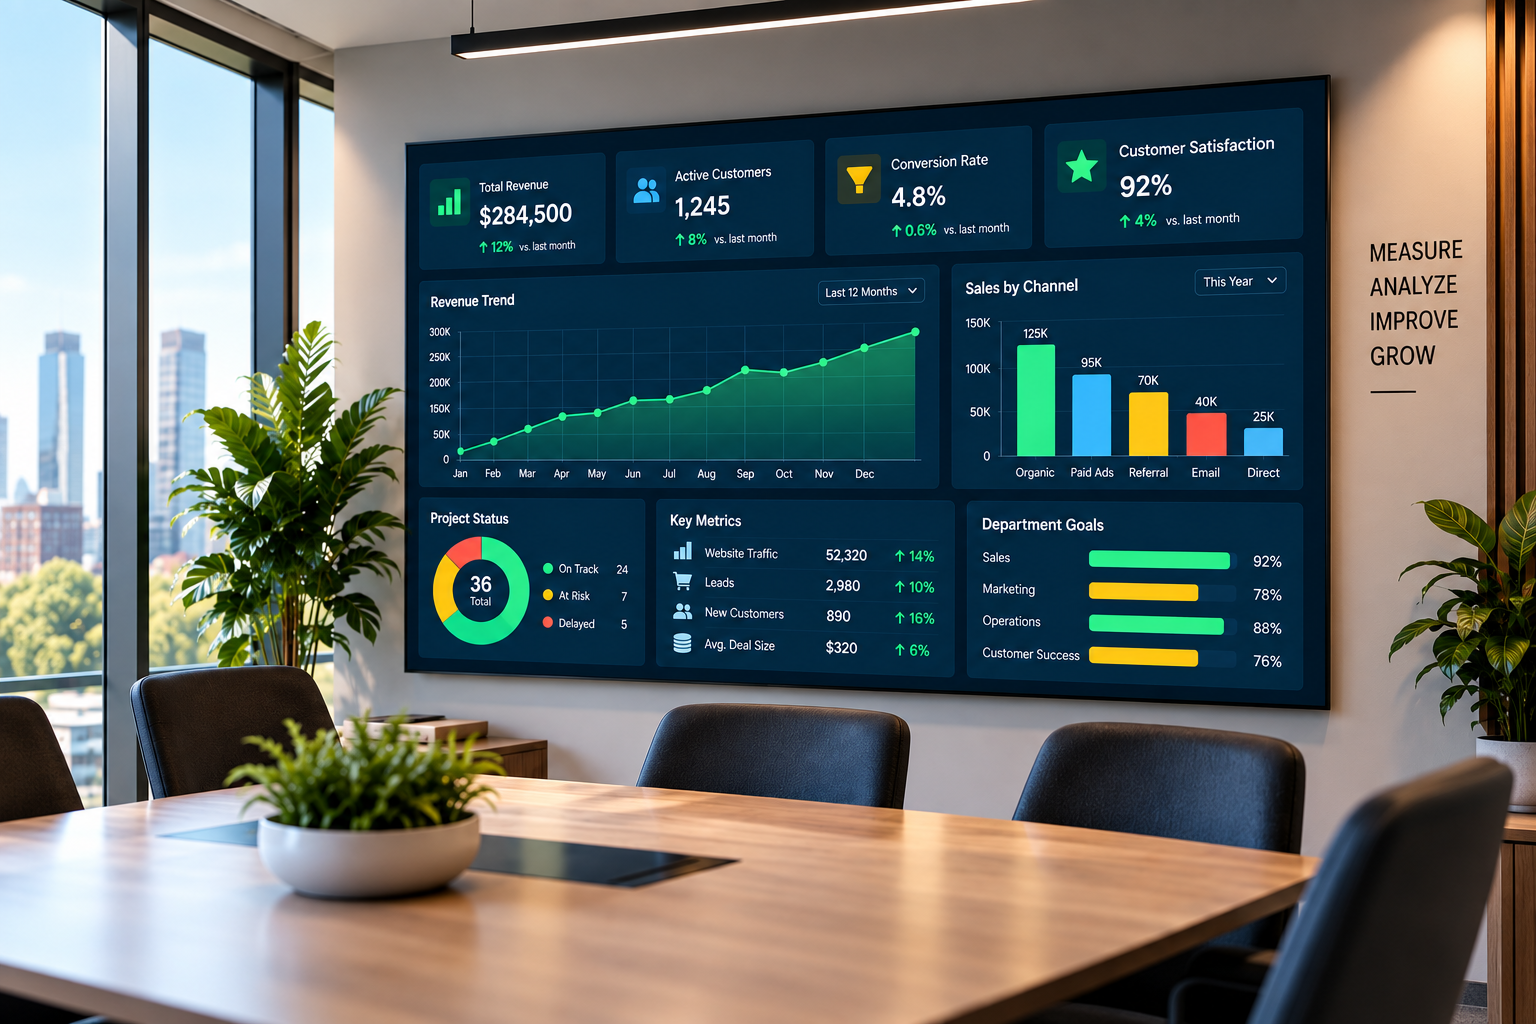
A founder with past $1M in revenue opens six browser tabs every Monday morning just to figure out whether last week was good or bad. Sales lives in the CRM. Cash sits in the accounting software. Marketing numbers hide in a third tool. By the time the picture comes together, the week is half gone, and the decision is already late. A KPI business dashboard fixes exactly this. It pulls the numbers that matter into one live view, so you can see company health in seconds, not hours. This guide covers what a dashboard is, why visibility matters, the main types, and how to build a KPI dashboard in seven steps that actually gets used.
What is a KPI business dashboard (definition and how it works)
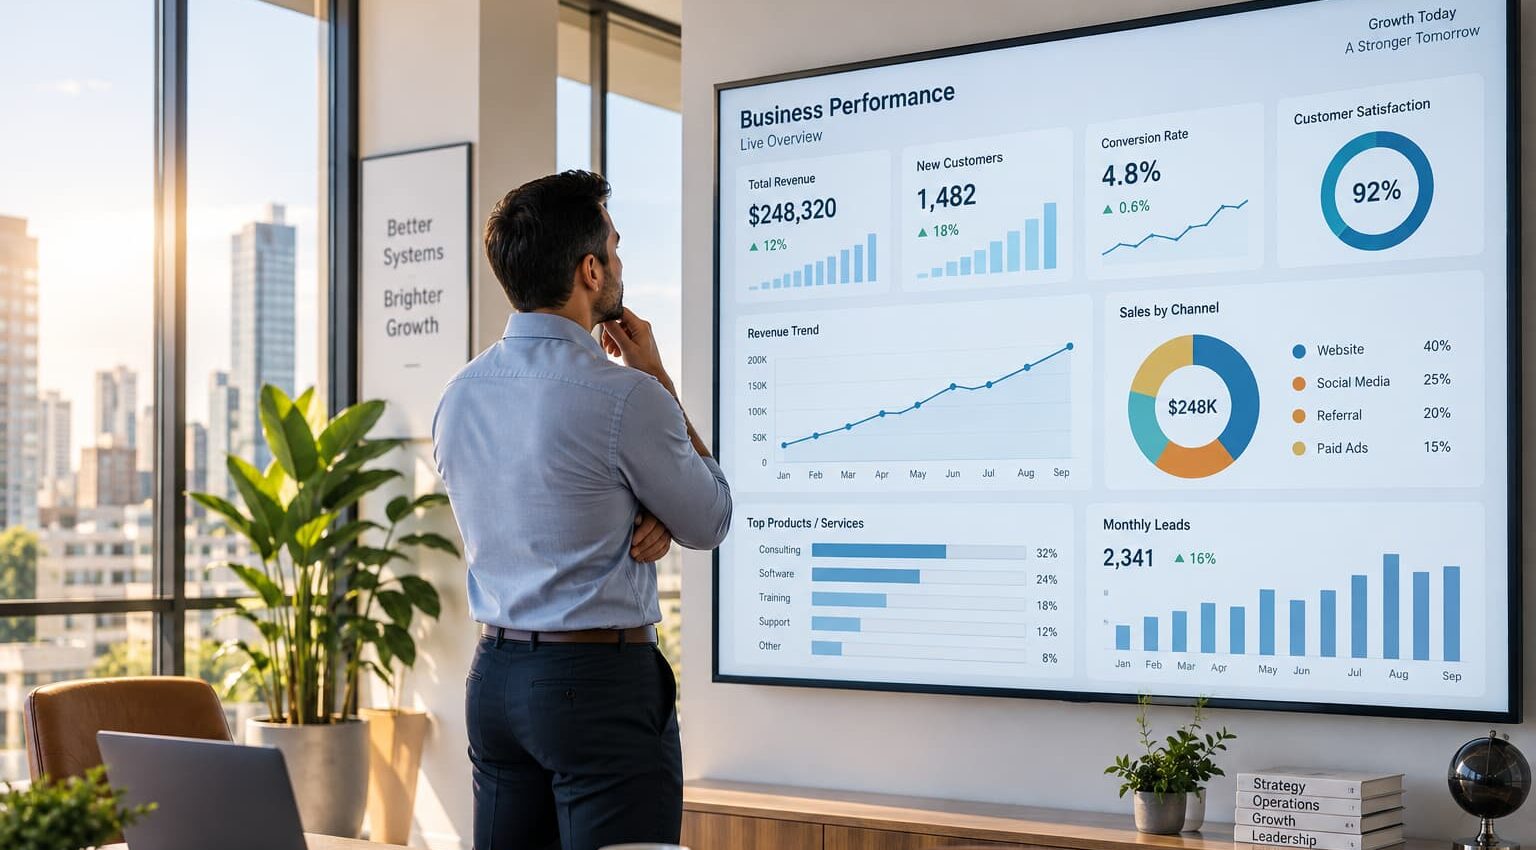
A KPI dashboard is a single screen that shows your performance metrics as charts, scorecards, and gauges. It refreshes from live data instead of hand-built spreadsheets. It connects to your data sources across sales, finance, marketing, and operations. Then it turns raw numbers into visual signals you can read at a glance. So what does a KPI dashboard do under the hood? It queries each system, applies your metric definitions, and renders the result. The same number means the same thing every time, and that consistency is the whole point: a dashboard earns trust only when its definitions hold steady, because a metric that shifts meaning between systems can’t be acted on. It’s why understanding what a KPI dashboard is starts with definitions, not tools. The balanced scorecard framework, well explained by Harvard Business Review, is a proven structure for choosing which indicators earn a spot on the screen. Kaplan and Norton’s balanced scorecard framework remains a useful lens for deciding what actually deserves attention versus what’s simply measurable.
Why KPI dashboards matter and the benefits of data visibility
The issue usually isn’t effort; it’s visibility. When founders can’t see business performance clearly, they make decisions based on gut feel and stale reports. Small problems compound quietly. A KPI business dashboard gives you real-time insight into what’s working and what’s slipping. That turns reactive firefighting into data-driven decision-making. Here’s why it matters: leading indicators like pipeline volume move weeks before revenue does, so a dashboard surfacing them buys you time to correct course before the result lands. Many assume dashboards are for enterprise teams. In reality, small business founders benefit most, because they’re often the only person holding the full picture. Clear performance metrics keep those small business founders out of guesswork. The U.S. Small Business Administration publishes practical guidance on tracking business metrics as you grow, and its resources on tracking financial metrics as your business grows reinforce why financial visibility deserves a permanent place on your screen. Keep in mind that reporting and compliance rules vary by jurisdiction and business type, so confirm which financial metrics you’re required to track with your local regulator or a qualified advisor before building them into a dashboard.
Types of KPI dashboards (operational, strategic, tactical, analytical)
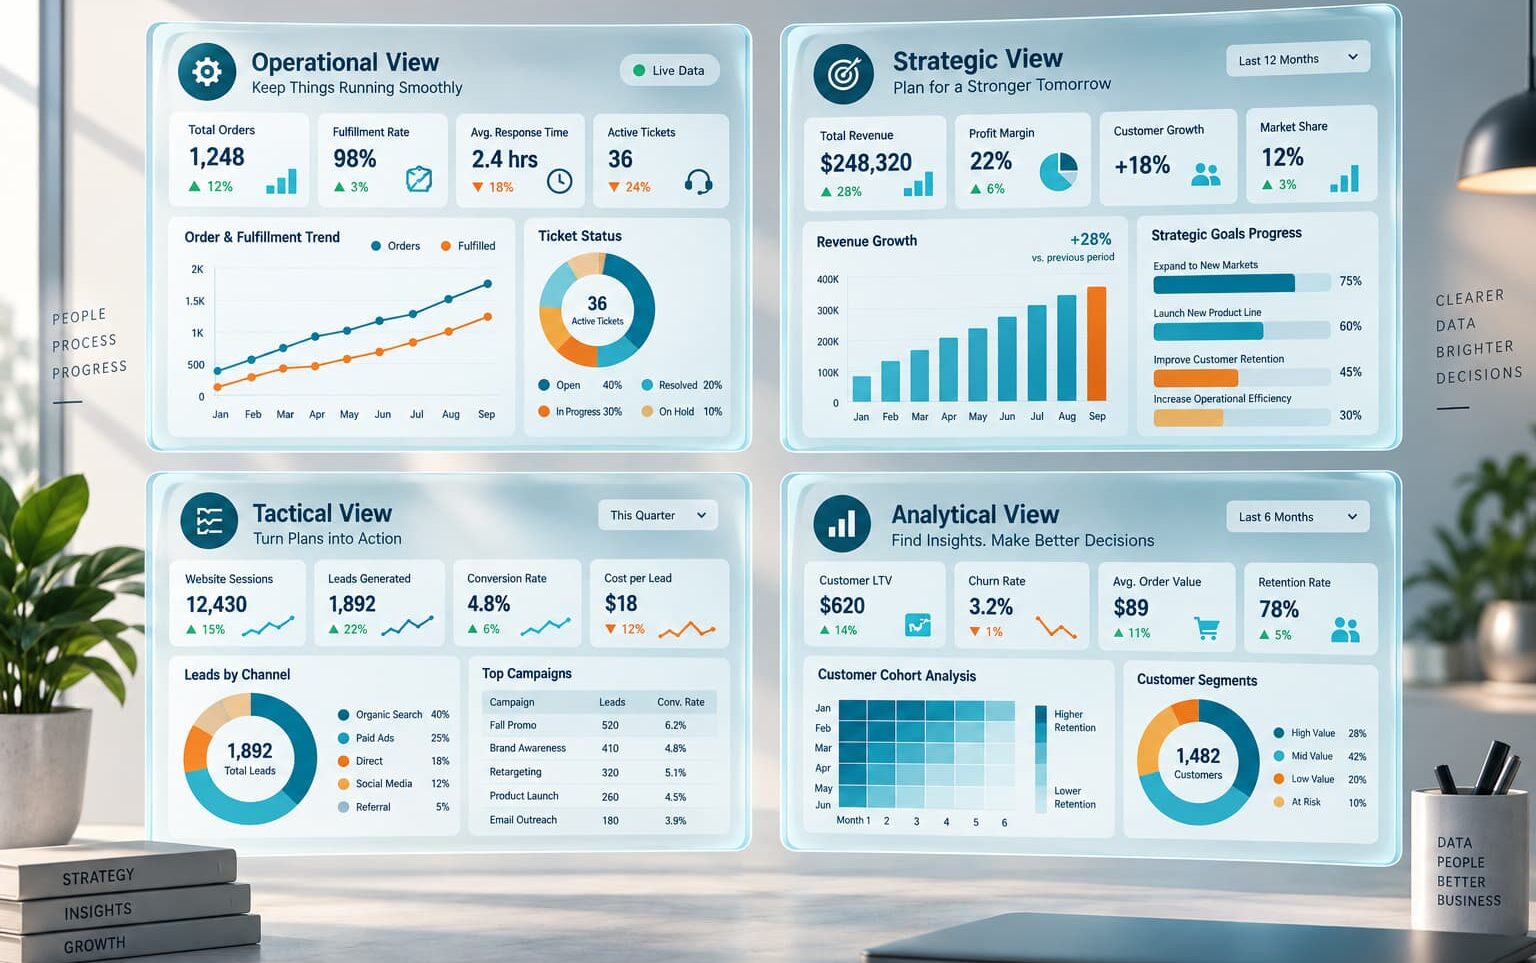
Not every dashboard serves the same job. An operational dashboard monitors day-to-day activity in near real time. Think order volume, support tickets, or production throughput. It gives frontline teams operational visibility. A strategic dashboard, often an executive KPI dashboard, tracks progress against strategic objectives and business goals over quarters, not hours. A tactical dashboard sits in the middle. It helps department leads manage projects and mid-term performance metrics. An analytical dashboard goes deeper, letting you explore trends and dig into why numbers moved. Most companies run more than one. A founder might check a strategic dashboard weekly while an ops manager lives in an operational dashboard all day. Each one is tuned to the decisions that person makes.
Step 1: Define your business goals and audience for the dashboard
Start with decisions, not data. Before choosing a single metric, write down who will look at this dashboard and what they need to decide. An executive tracking strategic objectives needs a different view than a sales manager watching daily activity.
- Name the primary audience (founder, ops lead, sales team).
- List the recurring decisions they make and how often.
- Tie each decision to the business goals it serves.
- Decide the refresh cadence that matches those decisions.
Skip this step, and you’ll build a beautiful screen nobody uses. Clarity about audience and business goals keeps the dashboard focused on what matters, not on everything that’s measurable.
Step 2: Select the right KPIs to track
Now pick the key performance indicators that answer those decisions, and only those. The goal is to measure what matters, not to fill space.
- Draft a candidate list of business metrics for each goal.
- Cut anything that doesn’t drive a decision.
- Balance lagging indicators (revenue, profit) with leading ones (pipeline, trial signups).
- Limit the final set to 3-7 KPIs per view.
The 4 main KPIs most founders anchor around are revenue, margin, cash flow, and customer retention. Your set should reflect your model, though. A sales KPI dashboard leans on pipeline and win rate. A financial KPI dashboard tracks cash runway and margin. If you’re unsure where to start, our guide to choosing the right KPIs for your business walks through how to match metrics to the decisions you actually make. Track your KPIs against targets, not just in isolation, so you always know if you’re on pace.
Step 3: Identify and connect your data sources
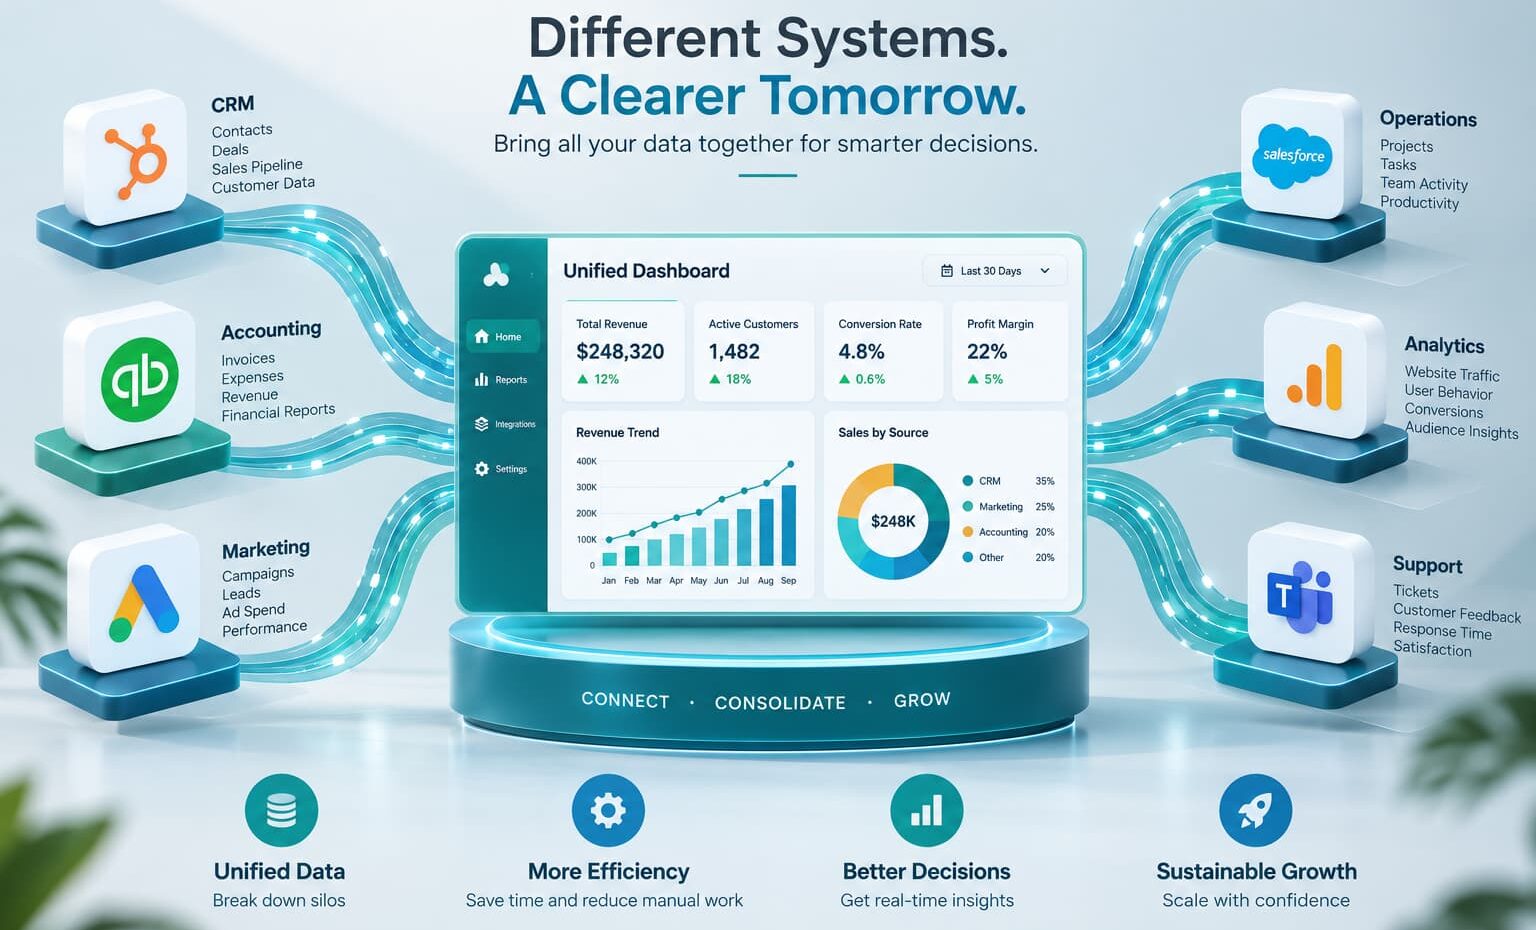
A dashboard is only as trustworthy as the numbers feeding it. Map every metric back to where its data actually lives before you connect anything.
- List the data sources behind each KPI (CRM, accounting, ad platforms).
- Confirm each source’s owner and how current the data is.
- Standardize definitions so “active customer” means one thing everywhere.
- Set up automated connections or scheduled imports to kill manual copying.
Most dashboard distrust starts with inconsistent definitions across systems, not the tool. Picture a founder whose marketing team counts a lead the moment someone downloads a guide, while sales only counts a lead after a discovery call. The two dashboards never match, the Monday meeting turns into an argument about whose number is real, and no one acts on either. The same happens if your HR KPI dashboard defines headcount differently. Clean, consistently defined data sources are non-negotiable.
Step 4: Choose the right KPI dashboard software or tool
The tool matters less than people think. Plenty of founders run their first KPI dashboard in a spreadsheet before moving to dedicated KPI dashboard software. What actually matters is whether the tool connects to your data sources, refreshes automatically, and stays readable.
- Match the tool to your team’s technical comfort level.
- Confirm it integrates with your existing systems.
- Check that it supports the refresh rate you need.
- Weigh cost against how many people will use it.
Options range from spreadsheets to Power BI, Tableau, or Looker. Many platforms ship with dashboard templates to speed setup. Don’t overbuy. The best KPI dashboard software is the one your team will open every day.
Step 5: Design the dashboard layout and data flow
Good dashboard design guides the eye. People read top-left first, so put your most important KPI there. Let secondary metrics flow down and to the right.
- Place the highest-priority KPI in the top-left position.
- Group related business metrics together (all sales, all finance).
- Use whitespace to separate sections and reduce clutter.
- Keep one dashboard focused on one audience or purpose.
A common mistake to avoid is cramming every metric onto a single screen. The viewer’s eye then bounces around and lands nowhere, so nothing gets acted on. Strong dashboard design trades density for direction, so the layout tells a clear story. Focusing on the business performance metrics that matter at the $1M stage helps you decide what earns the prime top-left spot and what can move further down.
Step 6: Visualize KPIs with the right charts and indicators
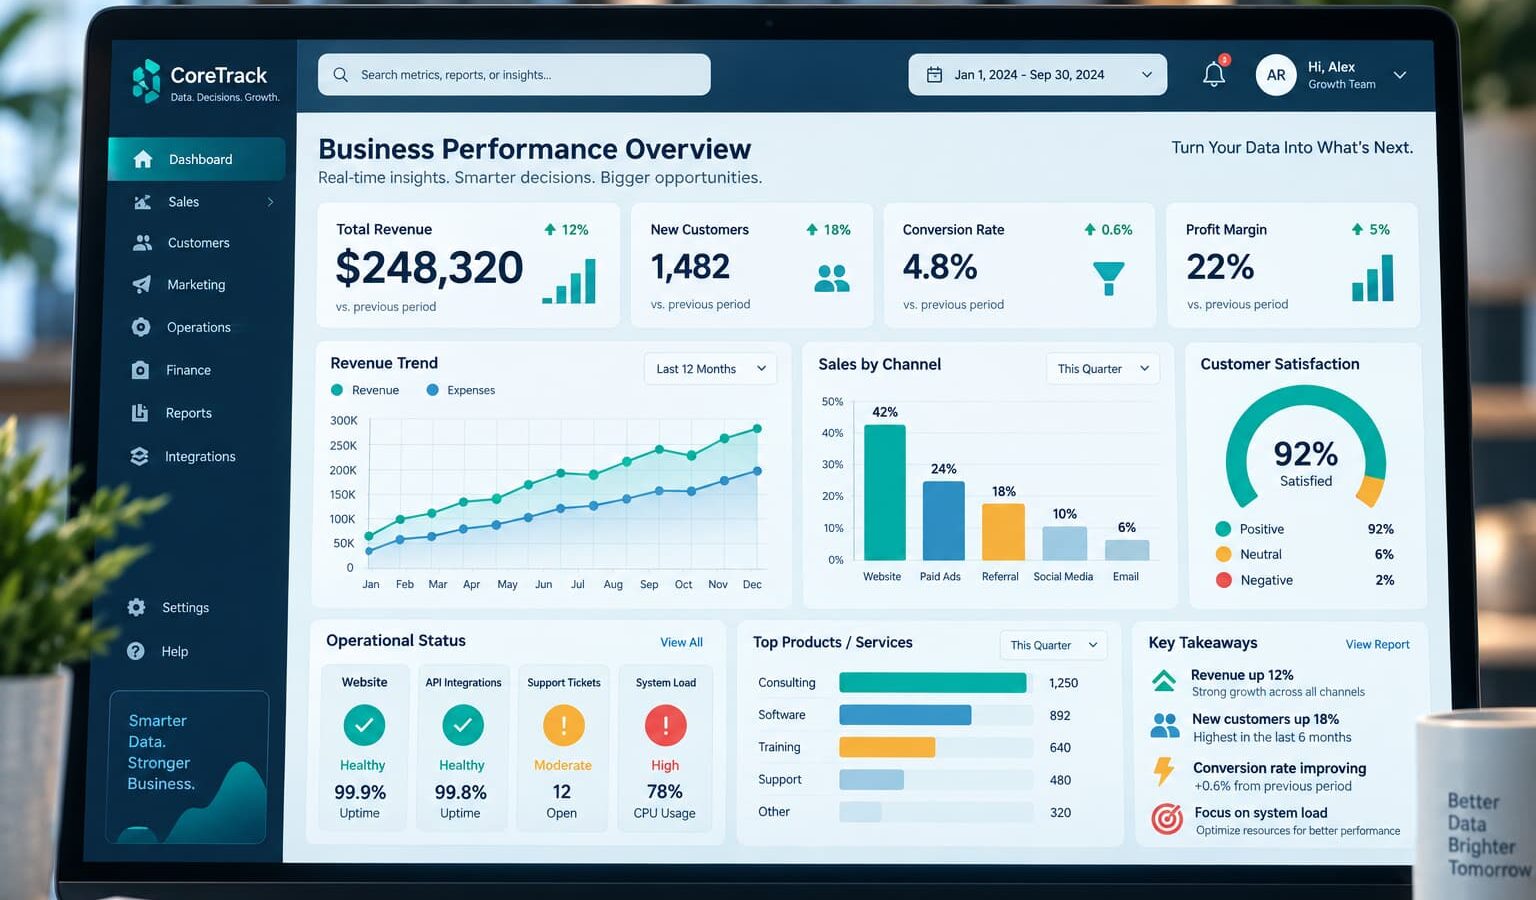
The chart type should match the question. Data visualization done poorly hides insight. Done well, it makes the answer obvious before you finish reading.
- Use line charts for trends over time.
- Use bar charts to compare categories.
- Use single-number scorecards for headline KPIs like revenue.
- Use gauges or color coding (red/yellow/green) to flag targets.
Avoid pie charts with more than a few slices and 3D effects that distort data. Good data visualization also means labeling clearly and showing the target next to the actual. Reviewing strong KPI dashboard examples from tools like Power BI or Tableau teaches more about effective data visualization than any style guide, because seeing how a clean layout answers a question at a glance is faster than reading rules about it. The sharpest KPI dashboard examples pair clean charts with plain labels.
Step 7: Review, iterate, and use the dashboard for decision-making
A dashboard nobody looks at is just decoration. Build a rhythm around it so it drives action, not passive glancing.
- Set a standing review: weekly for tactical, monthly for strategic.
- Ask “what decision does this number change?” for each KPI.
- Retire metrics that never trigger action and add ones that would.
- Adjust targets as your business goals shift.
The best practice here is simple: the dashboard exists to monitor performance and prompt decisions, not to be admired. Knowing how to build a KPI dashboard is only half the job. The other half is reviewing it, questioning it, and letting it evolve. When a KPI business dashboard becomes the first thing your leadership team opens in a meeting, you’ve turned data into genuine data-driven decision-making.
How founders avoid founder-dependency and vanity metrics when tracking KPIs
Vanity metrics feel good and change nothing. Total followers, page views, cumulative signups: they trend up forever and rarely tie to a decision. Swap them for performance metrics tied to real business results, like conversion rate or net revenue retention. The other trap is founder-dependency. If only you can read the dashboard, you’re still the bottleneck. Give your team access, agree on definitions, and let them track your KPIs and own their numbers. That way decisions don’t route through you. For founders who need ongoing operational leadership to embed these habits, The Integrator fractional COO package provides the hands-on support to keep systems running without you at the center. Building the right indicators and the systems behind them is exactly the operational visibility work that Four Indoor Courts supports through KPI identification and performance tracking for growing founder-led businesses.
If your business is growing faster than your systems can keep up, a KPI dashboard is only useful when the right metrics and clean data sit behind it. Four Indoor Courts helps founders identify the KPIs that actually matter and build the tracking to support them. If that’s the gap you’re facing, you can book a clarity call to map your operational blind spots and talk through where your visibility breaks down. Results vary based on leadership execution and how the systems get implemented, but the starting point is the same: visibility first.
FAQs
Q1. What exactly is a KPI in the context of a business dashboard?
A1.
A KPI is a measurable value that shows how well your business is hitting a strategic goal, such as revenue growth, customer churn rate, or operational efficiency. On a dashboard, you display those metrics together as charts, scorecards, or gauges so you can see performance at a glance instead of digging through separate reports.
Q2. How many KPIs should I actually put on one dashboard?
A2.
Keep it to 3-7 core KPIs per dashboard to avoid information overload. Every metric should map to a specific decision your team makes regularly: if it doesn’t support a decision, it doesn’t belong on the screen.
Q3. What are the five KPIs most small businesses start with?
A3.
There’s no fixed universal five, but founders past $1M typically start with revenue growth, gross or net profit margin, cash flow, customer acquisition cost, and churn or retention rate. The right set depends on the decisions you make most often, so match KPIs to your goals rather than copying a template.
Q4. What does a good KPI dashboard actually look like?
A4.
A strong example pulls data from finance, sales, marketing, and operations into one live view and refreshes automatically. It balances lagging indicators (results like revenue) with leading indicators (predictors like pipeline volume) so you can react before problems show up in the numbers.
Q5. How is a KPI dashboard different from a monthly business report?
A5.
A business report is a static document that looks backward over a set period with narrative and analysis, while a KPI dashboard is a live, frequently refreshed interface for quick daily or weekly checks. Reports explain what happened; dashboards show what’s happening now so you can act.

Founder of Four Indoor Courts Consulting, Leah Norris helps founders and growing businesses create operational clarity through fractional COO leadership, KPI-driven analytics, and scalable operational strategy. With a background spanning operations, finance, analytics, marketing, and technology, Leah specializes in helping businesses improve visibility, streamline processes, strengthen accountability, and build the operational structure needed for sustainable growth.