
A founder crosses $1M in revenue, hires three people, and suddenly can’t answer a simple question: which of these new sales are actually profitable? The revenue line looks great. Meanwhile, net margin is quietly shrinking because nobody is watching the numbers underneath it. That gap is exactly what business performance metrics are meant to close. This article breaks down which metrics matter at this stage, how to separate signal from noise, and how to turn those numbers into decisions your team will act on.

What business performance metrics are and why they drive growth
Business performance metrics are the numbers that tell you what is actually happening inside your company, not what you assume. They span finance, operations, sales, marketing, and people. Each one turns a vague feeling (“things feel busier”) into something you can act on. The reason this matters: growth hides problems. Revenue can climb while margins collapse, and without performance metrics you won’t see it until cash gets tight.
Well-chosen business metrics support data-driven decisions instead of gut calls. These key performance indicators give founders visibility into where the business creates value and where it leaks time or money. The U.S. Small Business Administration’s guide on managing your business finances walks through why tracking the right numbers early helps prevent the cash crunches that sink otherwise healthy companies.
Metrics drive growth because they shorten the distance between a problem starting and someone noticing it. That early warning is the whole point. Sustainable growth comes from catching small issues before they become expensive ones, which is central to optimizing operations rather than reacting after the fact.
The real problem: acting on data vs. having operational visibility
Most founders don’t lack data. They lack the visibility to act on it. Numbers sit in a payment processor, a CRM, a spreadsheet, and a bookkeeper’s monthly report, and none of them talk to each other. The issue usually isn’t effort. It’s that no one has a single view of how the business is performing right now.
What actually happens is founders make reactive decisions off the last thing they saw. A big invoice comes in, so hiring feels safe. A slow week hits, so they cut marketing. Neither move is grounded in a full picture. Real operational visibility means seeing sales, financial, and operational metrics together, on a cadence, so patterns show up before they force a decision.
Many assume more dashboards equal more clarity. In reality, more disconnected reports create noise. Gallup’s State of the Global Workplace analysis points to how unclear priorities erode team performance. Metrics scattered across tools create unclear priorities. Data visibility is about consolidation, not volume.
Financial metrics that matter (revenue, growth, gross/net margin, CAC)
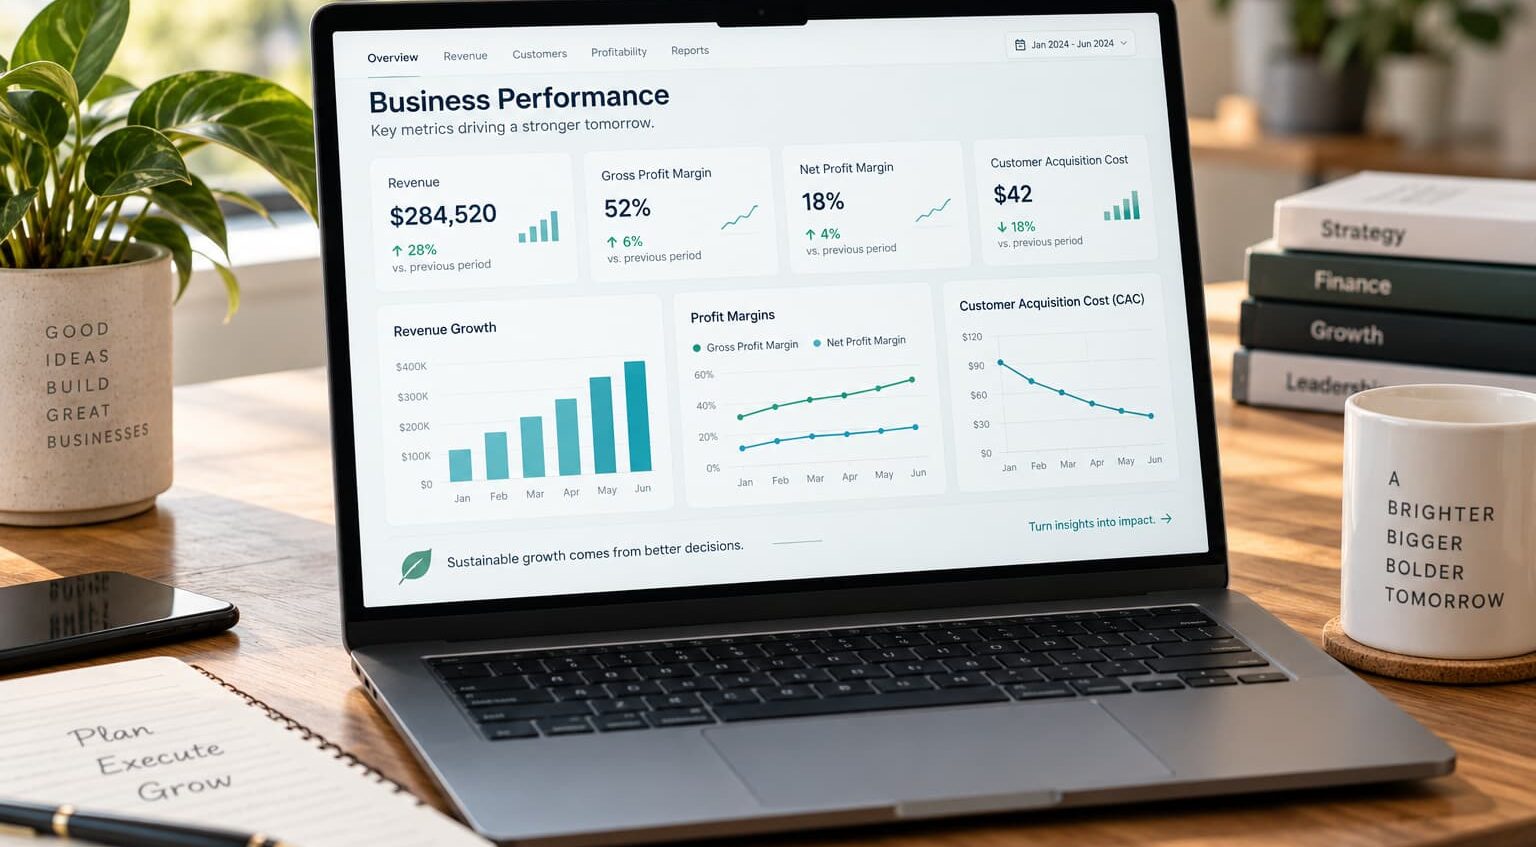
Start with the money. Sales revenue tells you demand exists. Revenue growth rate tells you whether that demand is expanding, flat, or slipping, and it’s the first business performance metric most founders watch. But revenue alone is a vanity number if you stop there.
Gross profit margin shows how much of each sale survives after the direct cost of delivering it. If gross profit margin is thin, no amount of revenue growth fixes the underlying problem. Net profit margin goes further, capturing what’s left after every expense. It’s the truest single measure of whether the business actually works.
Customer acquisition cost, or CAC, tells you what you spend to win each new customer. Rising CAC against flat sales revenue means your growth is getting more expensive. That’s a warning most founders catch too late.
These financial key performance indicators vary in relevance by industry, and tax treatment differs by entity type and state. Confirm definitions with your accountant before setting targets. These business metrics are only useful when measured consistently and tied to real financial goals.
Customer, sales, and marketing metrics (retention, acquisition, LTV)
Financial metrics tell you the result. Customer metrics tell you why. Customer retention rate is the one most growing businesses underweight, and it’s often the cheapest lever for revenue growth. Keeping an existing customer costs a fraction of winning a new one, so a small lift in retention often moves profit more than a marketing push.
Customer lifetime value, or LTV, pairs directly with customer acquisition cost. When LTV comfortably exceeds CAC, growth is healthy. When the gap narrows, you’re buying customers who don’t stick around long enough to pay back what you spent to acquire them.
On the sales side, track conversion rate, average deal size, and cycle length. These sales metrics reveal whether your pipeline is genuinely improving or just getting busier. Marketing metrics like cost per lead and channel-level return show which spending earns its place and which quietly drains budget.
The point of connecting customer metrics, sales, and marketing data is simple: it stops you from celebrating top-line growth that isn’t actually profitable. Read retention and acquisition together, never in isolation.
Operational and team metrics founders overlook
Founders watch revenue obsessively and ignore the operational metrics that predict it. That’s backwards. Operational bottlenecks, a slow fulfillment step, a support queue that keeps growing, an approval that only you can give, show up in operations data weeks before they show up in financials.
Track things like order fulfillment time, on-time delivery rate, capacity utilization, and error or rework rate. These operational metrics expose where work stalls. Picture a founder whose team hits a delivery ceiling not because demand dried up, but because one operational bottleneck, often approvals routed through the founder, capped how much the business could actually process. Orders back up, delivery times slip, and customers start churning before anyone connects it to a single approval step. The founder overwhelm was structural, not personal.
Team metrics matter too. Employee satisfaction and turnover rate are early indicators of operational health, because the people closest to the work feel the friction first. Non-financial goals like these protect your intangible assets: institutional knowledge, morale, and the trust that keeps good people in place.
Untangling these operational bottlenecks is exactly where fractional COO support helps. The Integrator fractional COO package gives founders operational leadership and the business systems to remove the founder-dependency trap without a full-time executive hire.
How to choose the right metrics for your stage and team
More metrics is not the goal. The right metrics is. Choosing the right metrics starts with your strategic objectives for the next 6 to 12 months, not with whatever your software happens to report. If a number doesn’t influence a decision you’d actually make, it doesn’t belong on your dashboard. A structured approach to identifying the right KPIs for your business keeps you focused on the handful that actually shape decisions.
Ask a blunt question of every candidate metric: if this moves, will we do something different? If the answer is no, cut it. A founder near $1M chasing thirty numbers has less clarity than one watching eight key performance indicators that map to real financial goals and operational priorities.
Stage matters, and here’s why: early on, you’re the only one executing, so cash flow and gross profit margin carry the most weight. As you add people, operational metrics and accountability structures become critical because decisions now happen without you in the room. Skip this step, and you build a kpi dashboard full of activity data that nobody uses to decide anything.
Match the metric to the decision, and match the decision to the owner. That’s how to measure business performance without drowning your team.

Setting up real-time tracking, dashboards, and KPI tools
Once you know what to measure, you need to see it without hunting. Real-time tracking means your core numbers update as the business runs, not once a month when the bookkeeper closes the books. That speed is what turns metrics from a rearview mirror into an early-warning system.
A KPI dashboard pulls your chosen metrics into one screen. Tools like Power BI, Tableau, and Looker Studio each fit different needs, but the tool matters less than the discipline behind it. A clean dashboard with eight well-defined metrics beats a sprawling one nobody trusts.
The mechanism that makes real-time tracking valuable is simple: it collapses the delay between an event and your awareness of it. A CAC spike or a retention dip you see this week costs far less to fix than one you discover next quarter. Knowing how to track business performance in real time is the whole case for data visibility.
Cleaning and connecting the underlying data is the hard part, and it’s where data and analytics support pays off. It turns scattered systems into reporting founders can actually trust. Start with what your existing business systems already produce before buying anything new.
Financial vs. non-financial and intangible measures
Numbers on a P&L are only half the story. Financial metrics tell you what already happened. Non-financial goals, employee satisfaction, customer sentiment, brand strength, process quality often predict what happens next. A team with rising turnover will eventually show declining financials, but the turnover signal comes first.
Here’s the root cause founders miss: intangible assets don’t appear on the balance sheet but heavily influence its future. Institutional knowledge walks out the door when an operations lead leaves. A damaged reputation shrinks your pipeline months before revenue reflects it. These are real drivers of sustainable growth even though they resist easy measurement.
Many assume only financial metrics count because they’re the ones you can precisely quantify. In reality, the leading indicators are usually non-financial, which is why balanced measurement matters. Pair a hard financial metric with a softer leading one: net profit margin alongside customer retention rate, revenue growth alongside employee satisfaction.
Tracking both keeps you from optimizing this quarter’s profit while quietly damaging next year’s. Success metrics that ignore intangibles tend to reward short-term moves that erode long-term value.
How to turn metrics into decisions and accountability (action path)
A metric that nobody owns changes nothing. This is where most tracking efforts quietly fail. The numbers get collected, a report gets emailed, and the business runs exactly as it did before. Turning your key performance indicators into results follows a specific path.
First, give every core metric an owner, a target, and a review cadence. Use weekly for operational metrics, monthly or quarterly for financial metrics. Second, in each review, ask one question per metric: Is it on target? If not, what’s the next action, and who does it by when? That single habit builds accountability into the numbers.
Third, connect the metric to a decision in advance. Define the threshold that triggers a response before the number moves, so you’re not debating in the moment. If CAC exceeds a set ceiling, pause that channel and review. If fulfillment time crosses a line, escalate that operational bottleneck immediately.
This is how data-driven decisions actually get made, not through more data, but through clear ownership and pre-agreed responses that support sustainable growth. Accountability structures turn passive reporting into active management. Results vary based on leadership execution, market conditions, and how consistently the cadence holds.

Getting started: the Readiness Audit and a clear next step
You don’t need to overhaul everything to start measuring what matters. The first move is honest: which decisions are you making blind right now? Most founders can name two or three within a minute: which sales are profitable, why fulfillment slows, where the founder overwhelm actually comes from.
From there, pick five to eight business performance metrics tied to your current strategic objectives, assign each an owner, and set a review cadence you’ll genuinely keep. Small and consistent beats ambitious and abandoned. Learning how to track business performance is less about tools and more about the discipline of looking, deciding, and following through.
A structured readiness audit speeds this up by identifying where your operational visibility is thin and which business systems need to feed cleaner data. A free 30-minute Readiness Audit gives you an outside read on where friction is slowing progress before you commit to any bigger change. That readiness audit is a low-stakes way to see how to measure business performance in your specific context.
If your business is growing faster than your systems can support, a clarity call with Four Indoor Courts can help pinpoint where operational friction is costing you profit and bandwidth. Book a call with Leah Norris to map the business performance metrics and systems that fit where your company is right now.
FAQs
Q1. What are business performance metrics, exactly?
A1.
Business performance metrics are quantifiable measures that track how parts of your company- finance, operations, marketing, or HR- are actually performing. They show what is happening, such as revenue growth rate, average ticket resolution time, or daily output, so founders can spot problems before they compound.
Q2. What are five metrics every growing business should track first?
A2.
For founders scaling toward or past $1M, the core five are revenue growth rate, gross profit margin, customer acquisition cost (CAC), customer lifetime value (CLV), and net profit margin. Together they reveal whether demand is rising, whether that demand is profitable, and how efficiently you’re spending to win customers.
Q3. What's the difference between a KPI and a regular business metric?
A3.
Metrics are broad and numerous: any number you can measure, like website visitors or units produced. A KPI is a small subset of those metrics tied directly to a strategic objective, so it signals whether you’re on track toward a specific goal rather than just describing activity.
Q4. How do I choose the right metrics instead of drowning in data?
A4.
Start with your top strategic objectives for the next 6-12 months: for example, ‘increase gross margin by 4 points, and only track metrics that tie directly to those goals. If a number doesn’t influence a decision you’d actually make, question whether it belongs on your dashboard at all.
Q5. Do performance metrics really improve profitability, or just create more reports?
A5.
Metrics like gross margin, net profit margin, and return on assets give leaders clear visibility into how revenue converts to bottom-line profit and where costs are quietly eroding it. The profitability gain comes from acting on early signals: catching rising labor or inventory costs before they snowball- not from the reports themselves.
Q6. Is metric tracking worth it for a small business that already feels stretched thin?
A6.
For most founders, the issue isn’t effort: it’s visibility, and a handful of the right metrics prevents reactive decision-making that wastes far more time than tracking does. You don’t need enterprise tooling to start; a small set tied to your goals delivers more insight than dozens of vanity numbers you never review.
Q7. What tools do I need to track business performance metrics?
A7.
Common options include Power BI (around $14/user/month for Pro and strong for Microsoft 365 users), Tableau for advanced data exploration, and Looker Studio for lighter needs. The right choice depends on your data maturity, not the feature list: many founders start with reporting already inside their existing systems before adding a dashboard tool.
Q8. What if I've been tracking metrics but nothing in the business is actually changing?
A8.
That usually means the metrics aren’t tied to decisions or reviewed at a set cadence- monthly or quarterly- so they describe the past instead of driving action. Fixing it means assigning each metric an owner, a target, and a clear next step when it moves off track.

Founder of Four Indoor Courts Consulting, Leah Norris helps founders and growing businesses create operational clarity through fractional COO leadership, KPI-driven analytics, and scalable operational strategy. With a background spanning operations, finance, analytics, marketing, and technology, Leah specializes in helping businesses improve visibility, streamline processes, strengthen accountability, and build the operational structure needed for sustainable growth.