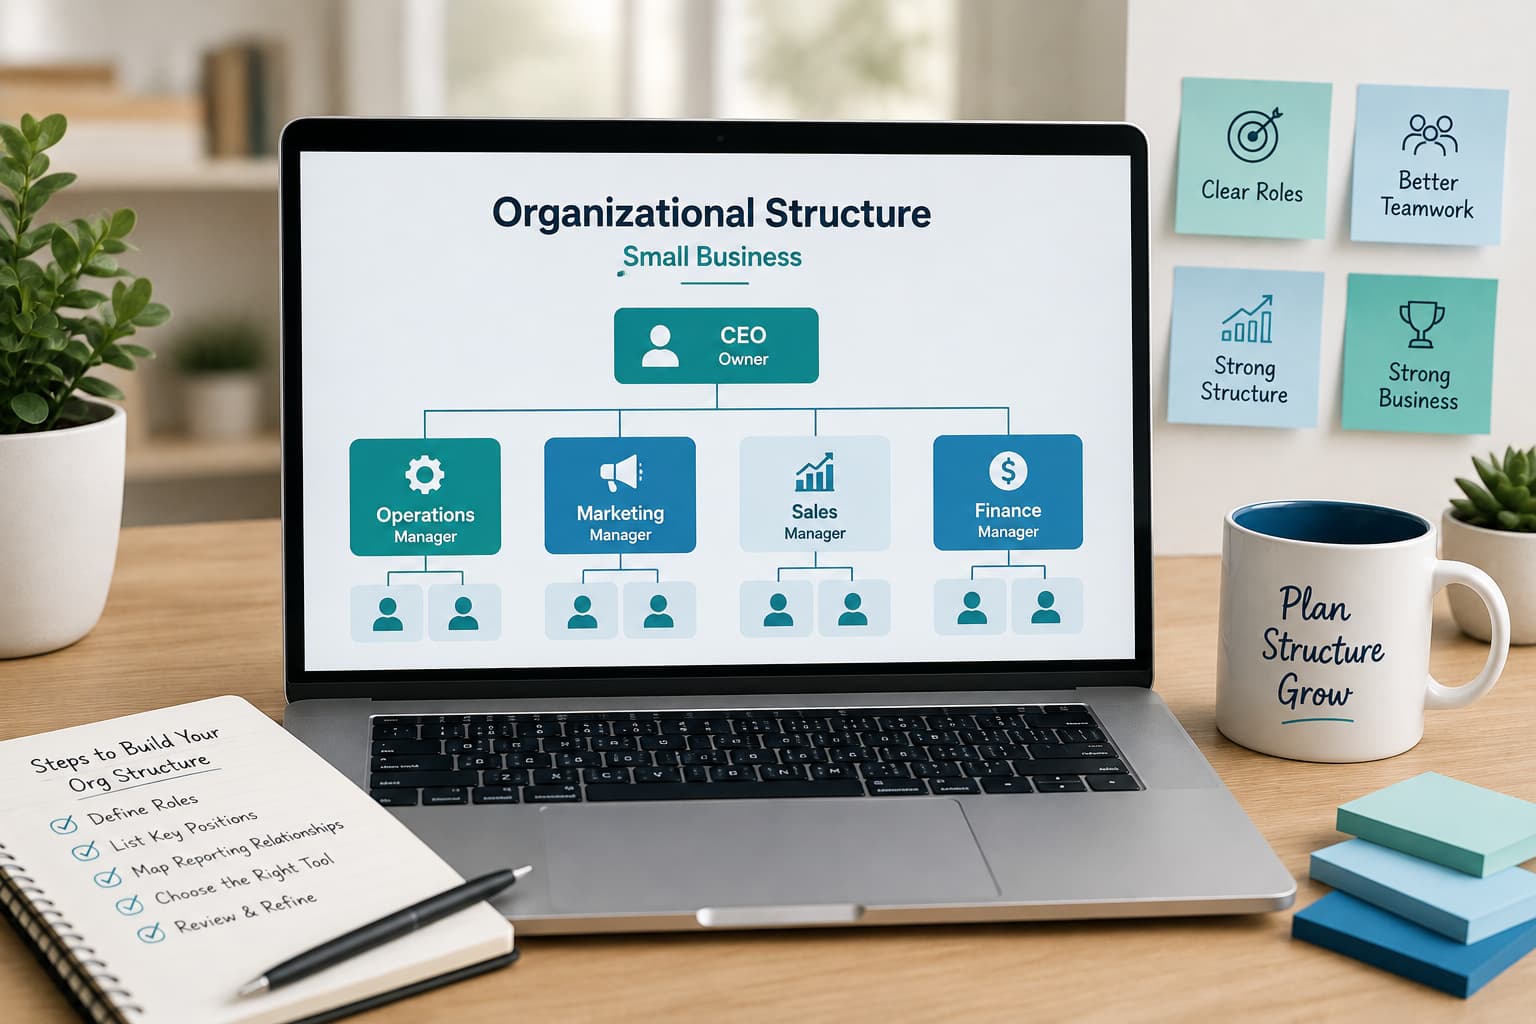
A founder with 14 employees told her operations lead to “just handle it.” Then she spent the next three weeks fielding the same questions she thought she had delegated. The problem wasn’t the team. Nobody could point to who actually owned what. That is the gap an organizational structure chart for small business fills. It turns a vague sense of “everyone does everything” into a clear map of roles, reporting lines, and decision-making authority. This guide walks through what the chart is, why it matters as you grow, the main structure types, and how to create an organizational chart that scales with you.

What is a small business organizational structure chart?
A small business organizational chart is a visual map of the company. It shows every role, who fills it, and how those roles connect through reporting lines. Think of it as the wiring diagram for your team. It lays out the reporting hierarchy, groups people into functions or departments, and makes the chain of command obvious at a glance.
At its simplest, a small business org structure answers three questions. Who does what? Who reports to whom? Who has final say on a given decision? Each box holds a role, usually a functional title like “Head of Operations” plus the person currently in that seat. Lines between boxes show reporting lines, not friendship or influence.
The reason this matters early is that a chart separates the role from the individual. When accountability lives in a person’s head instead of a defined seat, everything breaks the moment that person is out or leaves. The U.S. Small Business Administration’s guidance on choosing a business structure covers the legal side. The operational side, who owns which outcome, is what an org chart captures. It is less about hierarchy for its own sake and more about giving your team a shared reference for how work actually flows. Understanding how an organizational plan supports business success makes this connection between structure and outcomes even clearer.
Why a small business needs an organizational structure chart
Most operational problems start when a business grows faster than its structure. Sales climb, headcount doubles, and suddenly three people think they own client onboarding while nobody owns invoicing. The issue usually isn’t effort. It’s visibility.
An organizational structure chart for small business gives you operational visibility into how the team is wired before the cracks widen. It surfaces gaps in org structures, two people doing the same task, or an entire function with no clear owner. These quietly create operational bottlenecks. It also speeds up onboarding. A new hire who can see the reporting hierarchy on day one skips weeks of “who do I ask about this?” The SBA guidance on hiring and managing employees reinforces how much clarity around roles matters as you add people.
There is a real cost to skipping it. Gallup’s research on employee role clarity links unclear expectations to lower engagement and higher turnover. Turnover in a 15-person shop stings far more than in a corporation, because losing one person means losing a real share of your capacity overnight. A clear chart with well-defined employee roles supports delegation and strengthens accountability. It gives founders back the mental space to focus on growth instead of refereeing overlaps. Growth without systems creates friction, and the chart is one of the cheapest systems you can build.
Key elements of an effective organizational chart (roles, reporting lines, hierarchy)
A useful chart has a handful of parts, and skipping any of them weakens it. Start with roles. Use functional titles like “Lead Technician” or “Head of Marketing” rather than only names, so the structure survives when people change seats. Underneath each title, add the individual currently filling it.
Next come reporting lines. These are the solid lines connecting each role to the person it answers to, defining the chain of command. Keep them clean. Every role should have one clear primary manager, or you will recreate the confusion you’re trying to fix. The reason single-manager reporting matters is simple: when two people can both direct the same role, that role ends up serving whichever one asked most recently, and priorities quietly collide.
Then the hierarchy itself: the vertical layers from founder to frontline. In a small business org structure, fewer layers is usually better. Each layer you add slows decisions and adds distance between the founder and the work.
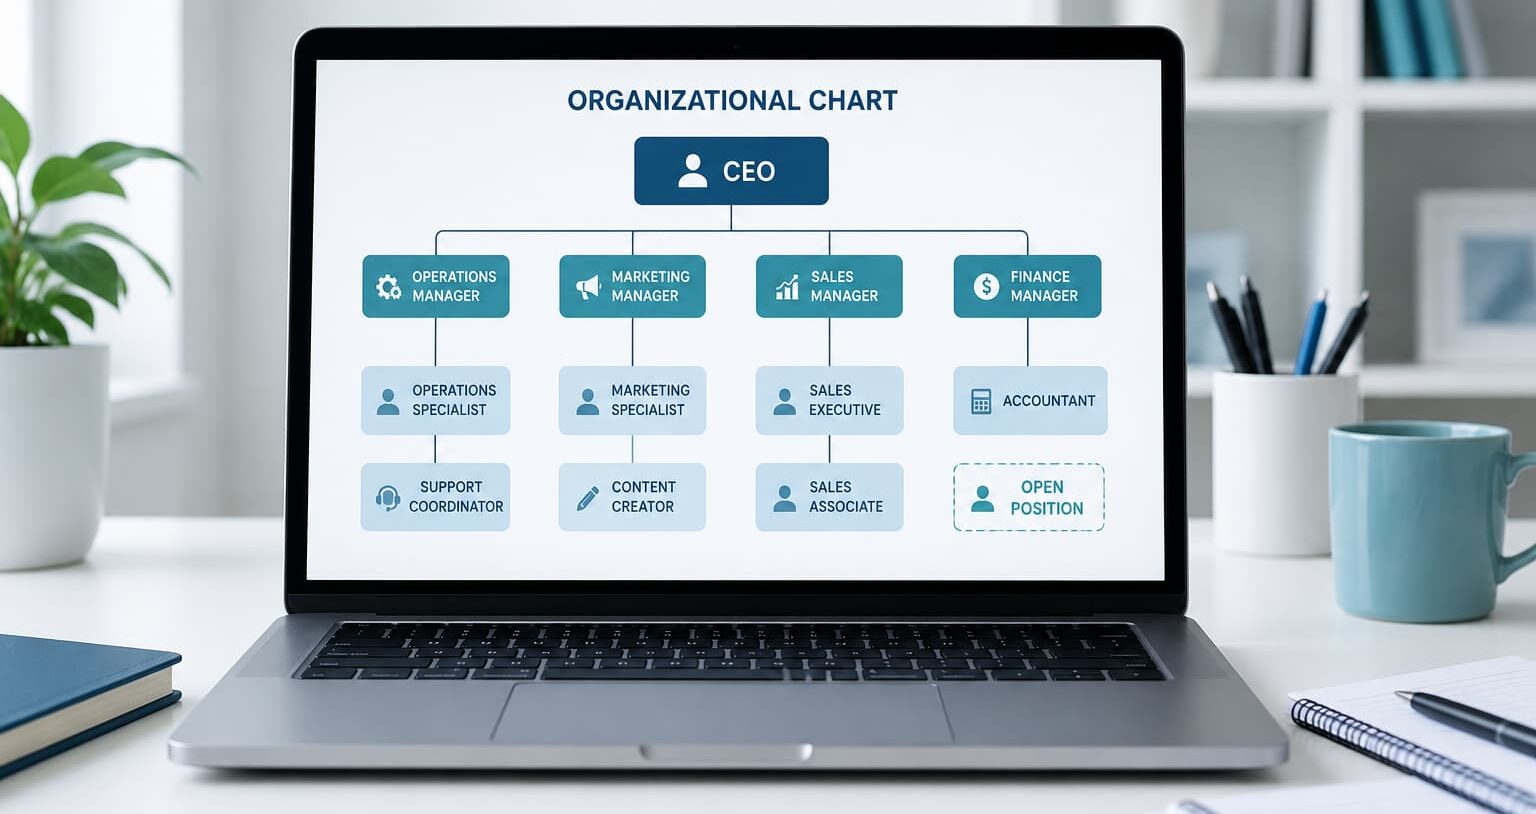
A few other elements strengthen the chart layout: departments or functional groupings, open or planned roles shown as empty boxes, and, where relevant, stakeholders who influence decisions without sitting inside the hierarchy. Many assume an org chart is just a status diagram showing rank. In reality, its job is to clarify accountability, who is responsible for which outcome, so the reporting hierarchy actually helps work get done.
Types of organizational structures for small businesses (hierarchical, flat, functional, matrix, divisional)
There are several types of organizational structures, and each fits a different stage and kind of business. Here are the ones small teams actually use.
A flat organizational structure has few or no management layers, with most people reporting directly to the founder. It is fast and cheap on overhead, which is why it suits teams under 10.
A hierarchical org structure adds clear vertical layers and a defined chain of command. It trades some speed for order. It works as you cross 20 employees and the founder can no longer manage everyone directly.
A functional reporting structure groups people by what they do: sales, operations, finance, each under a functional manager. This is the most common next step for a growing small business organizational chart.
A matrix organizational chart has people reporting to two managers at once, say a project lead and a functional head. It fits project-heavy work but adds complexity, so use it carefully.
A divisional organizational chart organizes around products, regions, or customer segments, each division running semi-independently. A process-based structure organizes around end-to-end workflows instead of departments. And a network org structure leans on outside partners and contractors around a small core, common for lean, distributed teams. Match the type to how your work actually flows, not to what looks impressive.
How to choose the right structure for your business stage and size
The right small business org structure depends on three things: headcount, how work flows, and where you’re headed. Ignore the frameworks that fit a 5,000-person company. You need what fits the next 18 months.
Under 10 people, a flat organizational structure almost always wins. Decisions stay fast, and adding managers this early creates layers you don’t need. The founder can still give every direct report real attention.
Between 20 and 50 employees, span of control breaks down. The founder runs out of hours to meaningfully manage everyone, and decisions start stalling behind them. That is the signal to move to a functional reporting structure with a first tier of managers grouped by function.
Beyond that, businesses with distinct product lines, regions, or customer types often shift toward a divisional organizational chart. Project-driven firms may layer in a matrix organizational chart. Weighing these types of organizational structures against where the friction lives right now matters. If onboarding is chaotic and no one owns key outcomes, that is a structure problem, not a people problem. Match the chart to your reality so it supports business efficiency instead of adding bureaucracy.
Step-by-step: how to build an organizational chart for your small business
Here is how to create an organizational chart without overthinking it. Follow the steps in order.
- Define the purpose: clarifying employee roles, planning your next hires, or speeding up onboarding. The purpose shapes what you include.
- Set the scope: decide which positions to show and whether to include open or planned roles as empty boxes.
- List every role: write out each job title and the person filling it, using functional names, not just individuals.
- Map the reporting lines: note who each role reports to, giving every position one clear primary manager.
- Choose your structure: pick flat, functional, or another type based on your size and how work flows.
- Draw the chart layout: place the founder or top decision-maker at the top, then arrange roles into boxes with connecting lines showing the reporting hierarchy.
- Add supporting company information: departments, locations, or key stakeholders if they clarify how decisions get made.
- Review with your team: confirm the reporting lines reflect how work actually happens, not how you wish it did.
- Save it as a living document and revisit it each time you add a management layer.
That is the full process for how to create an organizational chart your team will actually use.
Using templates and tools to create your org chart
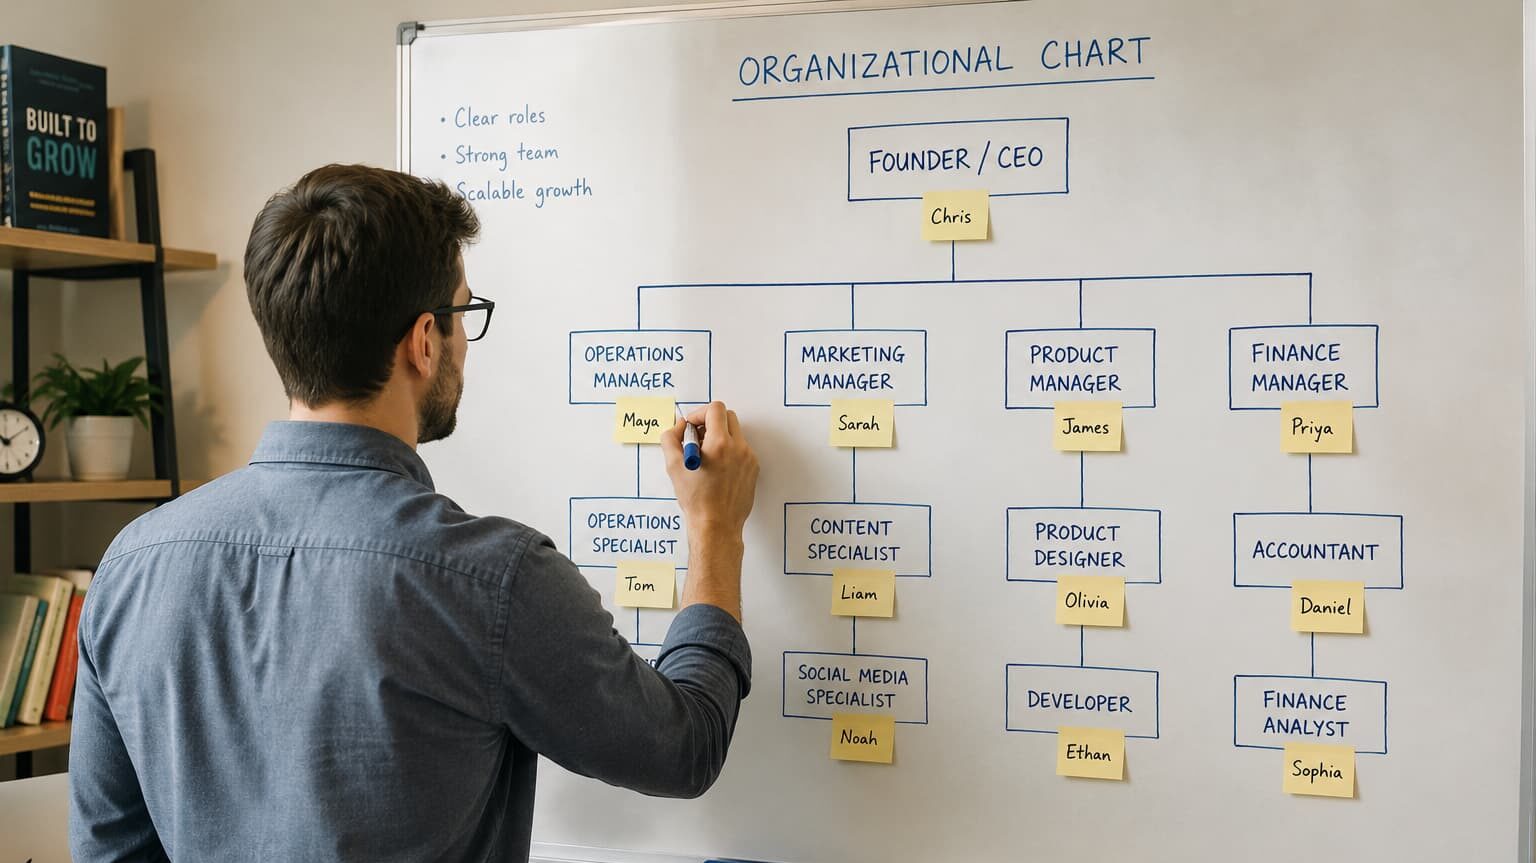
You don’t need to draw an org chart from scratch. An org chart template gives you a starting layout you can fill in with your own roles and reporting lines in an afternoon. Most tools ship with several template options for flat, functional, and hierarchical setups.
For visuals, Lucidchart and Smartsheet are solid choices. Both let you build a small business organizational chart with drag-and-drop boxes and auto-connecting lines. Asana and monday.com work if your chart doubles as a project and ownership view. For a fast first draft, ChatGPT can turn a plain list of roles into a text-based hierarchy you then paste into a diagramming tool for polish.
Whatever you pick, prioritize two things. First, easy editing, because your org chart template is a living document you’ll update every time you add a role. Second, shareability, since the chart only helps if the whole team can see it. Cloud-based tools that stay current beat a static file buried in someone’s drive. The reason shareability matters more than polish is that a chart nobody can find defaults back to guesswork, which is the exact problem you built it to solve. For remote teams especially, a shared, always-visible chart keeps everyone aligned on reporting lines when there’s no office wall to point at.
How to evolve your org structure as your business scales past $1M
Crossing $1M in revenue is where a small business org structure usually starts creaking. Sales grew. The structure didn’t. Scaling exposes operational weaknesses that a flatter setup hid when the team was smaller.
The evolution follows predictable stages of growth. Early on, flat and founder-led is fine. As you approach 20-50 people, you add a first layer of managers and split into functions. Past that, you build out defined departments with their own leaders and a clearer chain of command. Each shift is a change management moment. Telling a team the reporting hierarchy is changing needs communication, or you’ll spark confusion and protect company culture only by accident.
The reason this matters is that scaling your business without adjusting structure just concentrates more decisions on the founder, the opposite of what growth should do. Picture a founder who crosses $1.2M with the same flat setup that worked at five people: every hire still routes questions straight to them, and the calendar fills with approvals instead of strategy. This is often where founders bring in senior operational leadership. Four Indoor Courts provides fractional COO support that helps founders redesign the org structure and build the systems underneath it, without the cost of a full-time executive. The The Architect fractional COO package for scaling teams is built for exactly this stage. Handled with strong change management, restructuring can help turn revenue growth into more sustainable growth instead of a bigger version of the same chaos.
How org structure fixes founder overwhelm and operational bottlenecks
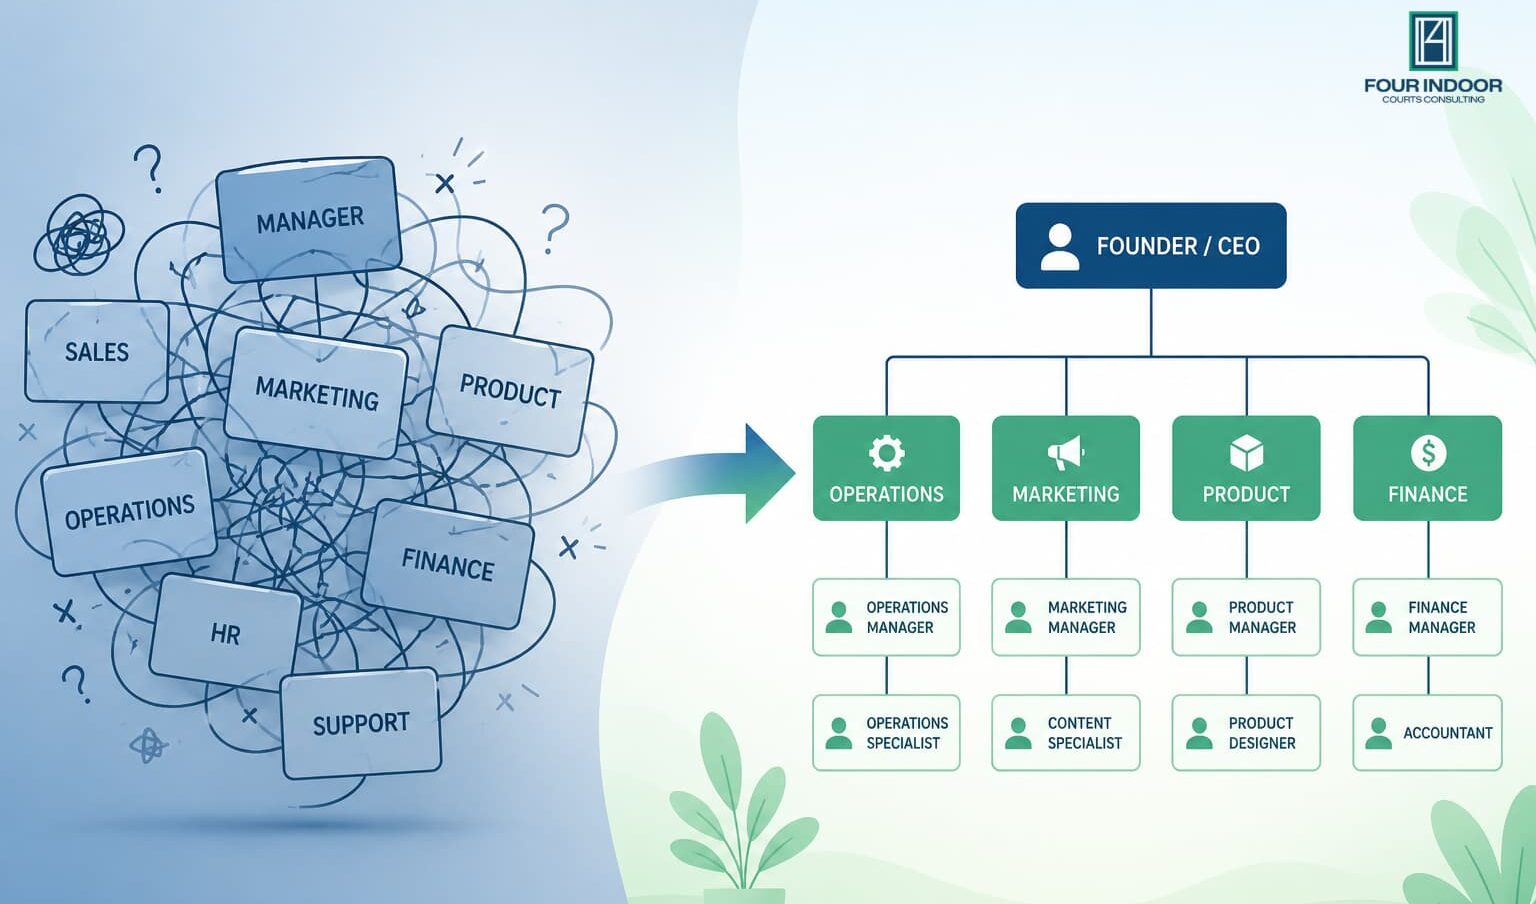
Founder overwhelm rarely comes from laziness or lack of ambition. It comes from being the single point every decision routes through. When no role owns a task, it defaults to the founder, and the founder becomes the operational bottleneck for the whole company.
A clear organizational chart breaks that pattern. By assigning outcomes to defined employee roles, it gives you a structure for delegation you can actually trust. Picture a services company doing $1.5M where the owner still approves every client quote. One approval takes minutes, but forty a week is a full workday lost. Every quote sits in a queue behind the founder until she’s free. Move quote approval to a named operations lead, and the bottleneck disappears while the founder reclaims a day a week. Pairing the chart with delegation strategies that make an org chart work is what turns that shift from theory into practice.
That is the mechanism. The chart makes ownership explicit, and explicit ownership is what makes delegation stick. Without it, “delegation” is just hoping someone picks up the slack. With it, operational visibility improves because you can see exactly where work flows and where it jams. Fixing structure won’t solve every problem, but it removes the specific bottlenecks that keep founders trapped in the day-to-day instead of running the business.
Connecting your org chart to accountability, KPIs, and delegation
A chart that just sits on a wall is decoration. The value shows up when you connect each role to what it’s responsible for. Under every box, name one or two outcomes that role owns, and the reporting hierarchy turns into an accountability map.
From there, attach a metric to each outcome. If the operations lead owns fulfillment, their KPI might be on-time delivery rate. Now the chart, the role, and the number all line up, and performance conversations get concrete instead of vague. This is where a small business organizational chart stops being an HR document and becomes an operating tool that drives business efficiency.
Delegation follows naturally. When a role owns a defined outcome and a measurable target, you can hand it off and step back, checking the number rather than hovering over the work. That is real accountability: clear ownership, clear measure, clear consequence. Building the KPI layer takes thought, which is where Four Indoor Courts helps founders develop KPI frameworks and performance tracking tied directly to their org structure. If you’re unsure where to start, you can book a free 30-minute Readiness Audit to see where the gaps are. Connect roles, outcomes, and metrics, and your business systems start running on visibility instead of the founder’s memory.
Building an organizational structure chart for small business is one of the clearest first steps out of that founder-dependent pattern, and you don’t have to figure out the sequence alone. Four Indoor Courts helps founders at or approaching $1M turn operational chaos into clear roles, accountable owners, and systems that scale, without the cost of a full-time COO. Book a clarity call to explore your options and pinpoint where operational friction is slowing your growth.
FAQs
Q1. How do I know it's time to add managers instead of everyone reporting to me?
A1.
The signal is span of control: when the founder can no longer give each direct report meaningful attention, often around 20-50 employees, communication gets informal and ad hoc, and decisions stall waiting on you. That’s when a functional split and a first tier of middle management stop chaos from scaling faster than your systems can handle.
Q2. What organizational structure works best for a small business?
A2.
For teams of 1-10 people, a flat structure keeps decisions fast and overhead low, while a functional structure (grouping staff into sales, operations, and finance under managers) fits businesses adding their first layer of management around 20-50 employees. The right choice depends on your headcount, growth plans, and how work actually flows, not a one-size-fits-all template.
Q3. What should a small business org chart actually include?
A3.
List the owner or founder at the top if they hold final decision-making authority, then use functional role names like ‘Head of Marketing’ or ‘Lead Technician’ rather than just people’s names. Add the individual filling each role plus clear reporting lines so accountability and ‘who reports to whom’ are obvious at a glance.
Q4. How do I build an org chart from scratch when I've never had one?
A4.
Start by defining the purpose, clarifying roles, planning growth, or speeding up onboarding, then set the scope of which positions to include and whether to show open roles. Next, make a full roster of every job title and its reporting line, then map those into boxes and connecting lines using a tool like Smartsheet, Asana, or even ChatGPT.
Q5. Is an org chart really worth the effort for a business this small?
A5.
Even at under 20 people, an org chart forces you to name who owns what, which exposes overlapping responsibilities and hidden gaps that quietly create bottlenecks. The bigger payoff is onboarding: new hires understand how the business runs immediately instead of learning the reporting structure by trial and error.
Q6. What if my roles keep changing as we grow, won't the chart be outdated fast?
A6.
That’s expected, and it’s the point. Org charts evolve in predictable stages: very flat under 20 people, a first layer of managers and functional split around 20-50, and more defined departments beyond that, so treat the chart as a living document you revisit each time you add a management layer.
Q7. Can ChatGPT build an organizational chart for me?
A7.
ChatGPT can generate the structure, role hierarchy, reporting lines, and text-based or diagram-ready layouts, from a list of your positions, which speeds up a first draft. You’ll still want a dedicated tool like Lucidchart or Smartsheet for polished visuals, and a human review to confirm the reporting logic reflects how decisions actually get made.

Founder of Four Indoor Courts Consulting, Leah Norris helps founders and growing businesses create operational clarity through fractional COO leadership, KPI-driven analytics, and scalable operational strategy. With a background spanning operations, finance, analytics, marketing, and technology, Leah specializes in helping businesses improve visibility, streamline processes, strengthen accountability, and build the operational structure needed for sustainable growth.